When I first encountered histograms in my photography journey, I’ll admit I was a little intimidated. The term sounded more like something from a math class than something related to food photography. But as I spent more time learning about them, I realized that histograms are simply visual guides that show how light and shadow are distributed in an image. Once you understand how to read them, they become a valuable tool for improving exposure and creating stronger food photographs.
Jump to:
Let’s take a closer look at histograms and learn how to turn them from confusing graphs into practical tools for improving your food photography.
Understanding Histograms Basics
When I first came across histograms, they felt a bit confusing. I was already focused on things like Aperture, Shutter Speed, and composition, so adding graphs into the mix seemed overwhelming. But once I began to understand them, histograms became a helpful tool in improving my food photography.
What’s a Histogram Anyway?

- A histogram is a graphical representation of the tonal values in your image, showing how brightness is distributed across the photo.
- It maps tones from the darkest shadows on the left to the brightest highlights on the right.
- By displaying how many pixels fall within each brightness level, the histogram provides a quick overview of your image’s exposure.
Why Histograms Matter in Food Photography
- Lighting isn’t just important; it’s everything. It’s what brings out the shine of a sauce or the texture of a crust.
- The histogram acts as your guide, helping you evaluate exposure and avoid images that are too dark (underexposed) or too bright (overexposed).
I still remember the first time I adjusted a shot after checking the histogram. The result was an image that captured the subject’s colors and details much more accurately. That’s when I realized how helpful the histogram could be. It was a eureka moment! The histogram had shown me the light — quite literally.
Histograms: Where to Find Them and How to Read Them
Embarking on the histogram journey? First, let’s pinpoint where you can find these insightful tools, and then dive into deciphering their peaks and valleys.
Where to Spot Your Histogram
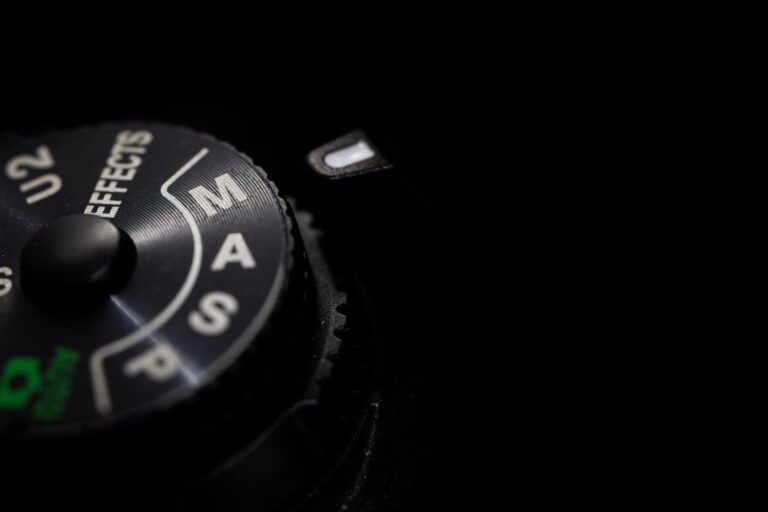
- In-Camera: Most modern digital cameras include a histogram display, which can usually be viewed on your camera’s LCD screen while shooting or when reviewing images.
- Editing Software: Programs like Lightroom and Capture One also display detailed histograms, allowing you to analyze and adjust your image’s exposure during editing.
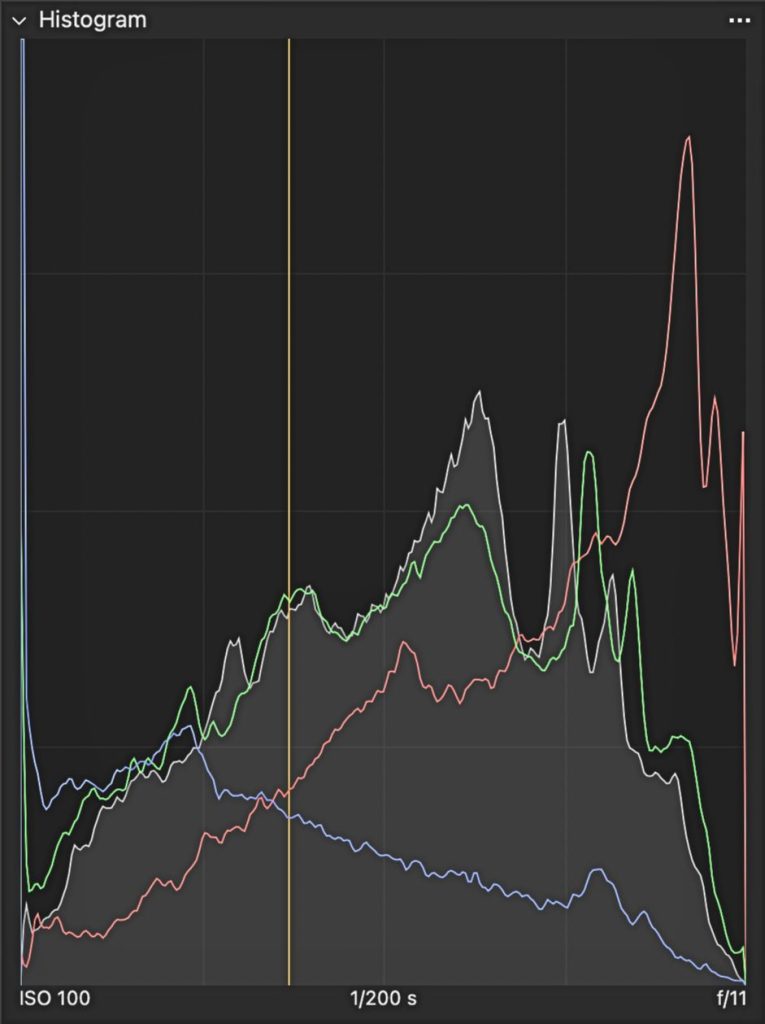
What does a Histogram show us?
A histogram shows the brightness levels in an image and how those tones are distributed across the photo. It helps you see whether your image is mostly bright, mostly dark, or balanced. And correct also plays a huge role in achieving tack sharp photography.
By reading the histogram, you can quickly tell if your photo might be overexposed, underexposed, or lacking contrast — making it a useful guide when adjusting exposure during editing.
BLACKS → SHADOWS → MIDTONES → HIGHLIGHTS → WHITES
The left side of the histogram represents pure black, while the right side represents pure white.
Between them are the shadows, midtones, and highlights that make up the tonal range of your image. A well-exposed photo usually shows a good spread of tones across the histogram without heavy clipping on either side.
Decoding the Peaks and Valleys
- Left Side: Represents the shadows or darker areas of your image. If this area is heavily concentrated with data, your photo may be underexposed.
- Right Side: Indicates the highlights or brighter areas. A strong concentration here can suggest potential overexposure.
- Middle Ground: This is where the midtones appear. A well-balanced histogram often shows a gradual spread across this area.
Understanding these elements can transform how you approach your shots, especially in food photography, where every detail matters. Whether it’s ensuring the glaze on a pastry is just right, or capturing the subtle hues of a fresh salad, the histogram is your guide to nailing the exposure every time.
How Histograms Can Enhance Your Food Photography
Now that you’re familiar with finding and reading histograms, let’s delve into how this tool can significantly improve your food photography. Mastering exposure through histograms ensures your subjects look as tantalizing in photos as they do in reality.
Optimizing Exposure with Histograms
- Avoiding Under and Overexposure: By keeping an eye on the histogram, you can adjust your settings to ensure your image is well-lit, capturing all the delicious details without losing them in the shadows or highlights.
Judging an image’s exposure based on appearance alone isn’t always reliable for achieving your vision. This is where Histograms come into play. This compact graph provides comprehensive details about your image’s exposure levels. By examining your Histogram, you can discern whether your image aligns with your intended exposure. If the graph leans left, your photo is likely underexposed (too dark); a right-leaning graph indicates overexposure (too bright). Instances of under or overexposure lead to what’s known as Clipping, which I’ll explain in more detail shortly.
- Balancing Contrast and Dynamic Range: A well-balanced histogram can help you achieve the perfect contrast and dynamic range, making your food images pop. A narrow histogram indicates low contrast, while a wide histogram with peaks and valleys suggests higher contrast.
- Highlight and Shadow Detail: By analyzing the histogram, you can see whether your image is losing detail in the highlights (on the right side) or the shadows (on the left side). When highlights or shadows become clipped, important details may be lost. The histogram acts as a useful guide to help you avoid these issues.
Now you ask me “What is Clipping”?
One key reason photographers use histograms is to identify clipping, which occurs when parts of the image are either too dark or too bright to retain detail. On a histogram, clipping appears when the graph is pushed against the far left or right edges. This means the camera’s sensor cannot capture texture or detail in those shadow or highlight areas.
- Clipping in Overexposed Images: If you notice a peak pushing against the histogram’s right edge, it may indicate overexposure. This means parts of the image have become pure white, causing a loss of detail in those highlight areas — an effect known as highlight clipping.
- Clipping in Underexposed Images: Similarly, when a peak presses against the histogram’s left edge, it may indicate underexposure. In this case, parts of the image turn pure black, leading to a loss of detail in the shadows, known as shadow clipping.
Spotting clipping can be difficult without a histogram, which clearly reveals when highlights or shadows are losing detail. Once clipping occurs, editing cannot recover information that the camera never captured. This can become especially noticeable in prints, where clipped areas may appear as flat white or solid black with no visible detail.
To avoid clipping, keep an eye on your histogram and try to maintain a small gap between the graph’s peaks and the edges.
Pro Tip
Both Lightroom and Capture One offer clipping warnings, which can be very helpful when evaluating highlights and shadows during editing.
What is a Perfect Histogram?
Histograms are valuable tools, but chasing a “perfect” histogram isn’t always necessary. Many great photographs include clipped highlights, deep shadows, or uneven tonal distributions. Exposure is ultimately a creative decision, so it’s best to treat the histogram as a guide — not a strict rule.
Aiming for a balanced histogram typically involves avoiding extremes, with your light distribution not hugging the graph’s edges. But if things aren’t lining up:
- If you notice most of the pixels leaning toward the left side of the histogram, it may indicate underexposure. In that case, you can add more light by opening your Aperture, slowing the Shutter Speed, or increasing the ISO — techniques you’ll learn when shooting in Manual Mode.
- Conversely, if the pixels are heavily concentrated on the right side, it may suggest overexposure. To correct this, you can reduce the light by narrowing the Aperture, increasing the Shutter Speed, or lowering the ISO.
I don’t chase what’s often hailed as a technically perfect histogram. The ideal histogram aligns with your vision and mood, ensuring no significant data loss from clipping your whites or blacks.
Practical Tips for Using Histograms in Food Photography
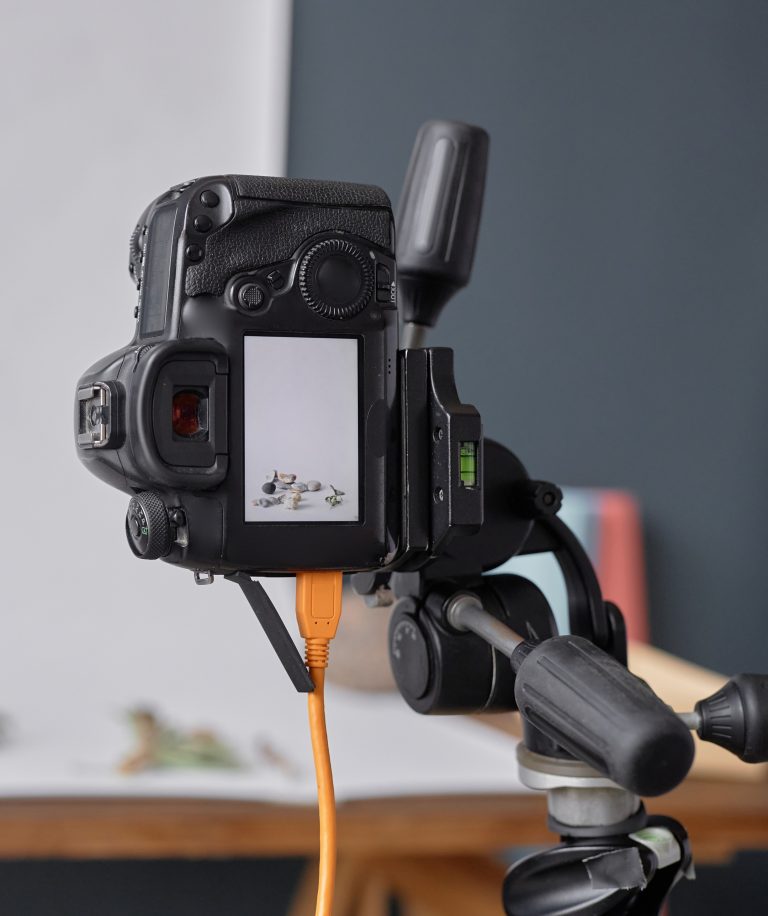
- Check Before You Shoot: Glance at the histogram after a test shoot to make adjustments before the final capture. This step is crucial in environments where lighting conditions change rapidly.
- Histograms in Post-Processing: Use histograms in your editing software to fine-tune exposure and contrast, ensuring your food photos look mouth-watering.
- Learn from the Extremes: Don’t be afraid of histograms that skew to the left or right. They can indicate a stylistic choice, like a high-key or low-key image, adding drama to your food photography.
By incorporating histograms into your workflow, you gain a clearer understanding of your image’s exposure. For food photography, this helps ensure your photos retain detail in both highlights and shadows, resulting in cleaner and more balanced images.
Beyond the Basics: Advanced Histogram Techniques for Food Photography
Elevating your food photography involves more than just understanding histograms; it’s about creatively applying this knowledge to produce compelling images. Let’s explore some advanced techniques that can help you use histograms to refine your food photos further.
Dynamic Range and Detail Preservation
- Highlight and Shadow Recovery: Use the histogram to check whether detail is being lost in the highlights or shadows. This helps you adjust exposure or editing settings to preserve important textures and color details in your subject.
- Dynamic Range Optimization: Aim for a histogram that displays a broad range of tones — from dark shadows to bright highlights — without heavy clipping at either end. This helps ensure your image retains depth, contrast, and detail.
Creating Mood and Atmosphere
- Intentional Clipping for Effect: Sometimes, pushing the histogram to its extremes can create a mood or focus the viewer’s attention on specific elements of your subject.
- Stylized Contrast: Use the histogram to adjust contrast levels, enhancing the drama and appeal of your food photography. High contrast can make colors pop, while low contrast can convey a softer, more natural look.
Consistency and Style Development
- Histograms as a Style Guide: By consistently analyzing the histograms of your successful shots, you can develop a signature style that’s recognizable and uniquely yours.
- Comparative Analysis: Use histograms to compare shots from different sessions, ensuring consistency in lighting and exposure across your portfolio.
By mastering these advanced histogram techniques, you’ll not only improve the technical quality of your food photography but also infuse your images with a distinctive style and character. Whether you’re aiming for a bright and airy look or a dark and moody atmosphere, the histogram is a powerful ally in your creative journey.
Histograms for Artistic Expression in Food Photography
Now, let’s take your food photography to an artistic level using histograms. It’s not just about getting the exposure right; it’s about using that exposure to tell a story, evoke emotions, and highlight the artistry of your subjects.
Telling a Story Through Exposure
- Using Exposure to Shape Mood: The histogram can guide your exposure when shaping the mood of an image. Darker tones may create a more intimate or dramatic look, while brighter tones can give a sense of freshness and lightness.
- Focus on Details: Adjusting the histogram to emphasize certain tones can draw attention to specific aspects of your subject, like the gloss on a chocolate cake or the steam rising from a hot soup.
Evoke Emotions with Light and Shadow
- Emotional Impact: The way you manipulate light and shadow can significantly affect how viewers feel about your image. Use the histogram to fine-tune these elements, enhancing the emotional appeal of your food photography.
- Contrast and Perception: Understanding how tones are distributed across the histogram can help you control image contrast, which influences how viewers perceive texture, depth, and detail in your food photographs.
By viewing histograms as a tool for artistic expression rather than just a technical guide, you can unlock new creative possibilities in your food photography. Whether you’re crafting an image for a high-end food magazine or capturing the beauty of a gourmet food product, histograms can elevate your photography from good to gastronomically great.
Conclusion: Making Histograms Work for Your Food Photography
Learning to use histograms can make a real difference in your food photography. Instead of guessing about exposure, you can quickly see how light and shadow are distributed in your image and make more informed adjustments.
At first, histograms may look a bit confusing — just a series of peaks and valleys on a graph. But they simply represent how brightness is spread across your photo. With a little practice, they become a reliable tool for improving exposure and consistency in your images.
Next Steps in Your Histogram Journey
- If histograms still feel a bit foggy, try some hands-on practice. Take a few photos with intentionally incorrect exposure, then review the histogram to see how those changes appear on the graph.
- You can also try a creative exercise: capture a series of images where highlights or shadows are intentionally clipped. Notice how this affects the image’s mood, contrast, and overall focus.
This kind of hands-on practice can help you better understand how histograms relate to your images. Rather than seeing them as strict rules, think of histograms as helpful guides that support more informed and creative exposure decisions.
So grab your camera, find a subject, and start experimenting with histograms to better understand light and exposure in your food photography.
. . . . .